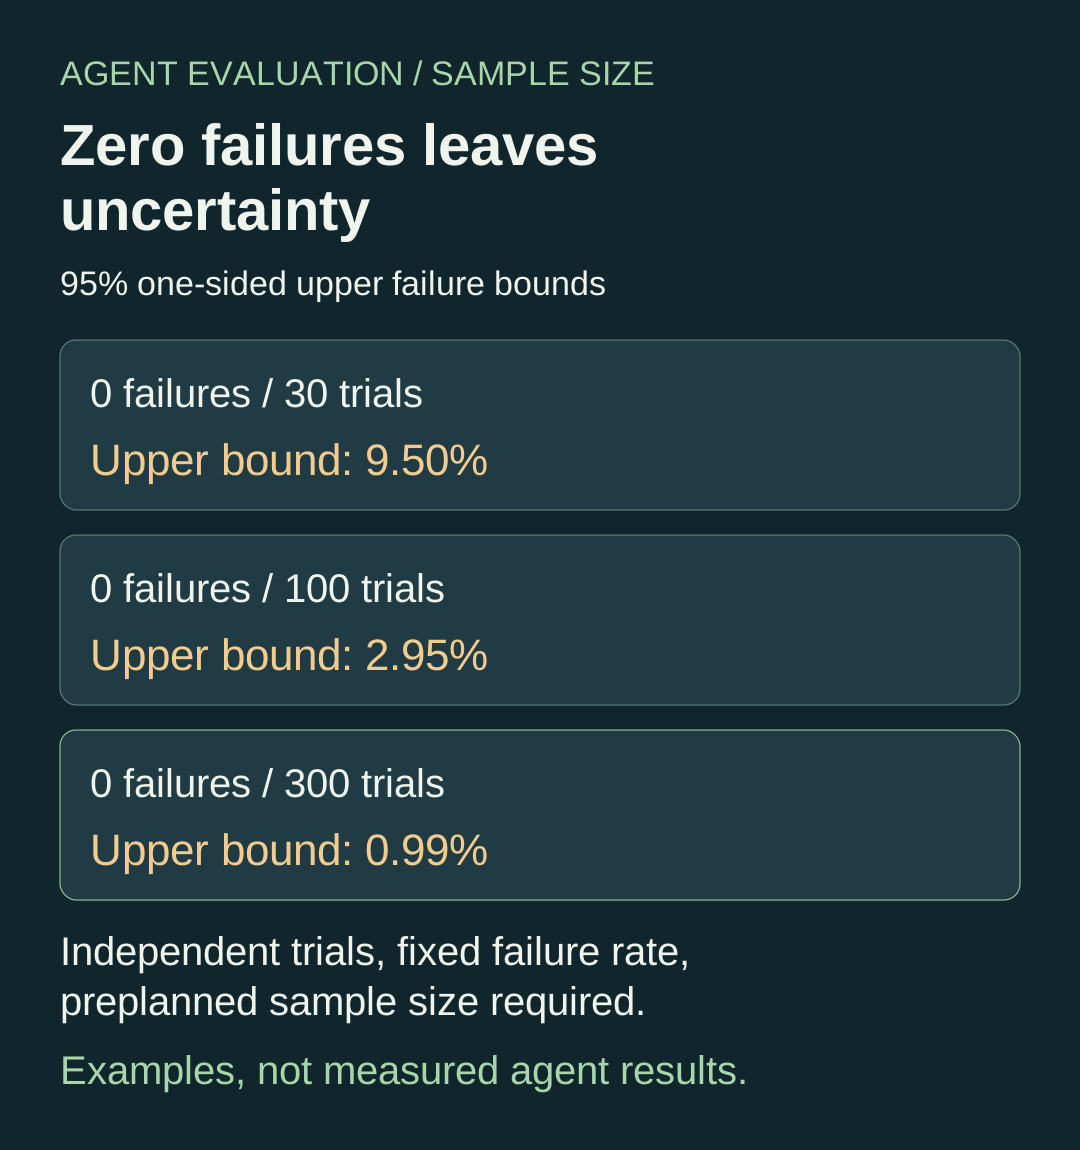
An agent passes 100 evaluation cases. The release report says “100% success” and someone proposes a production failure target below 1%.
I would not approve that inference. Even under a favourable statistical model, zero failures in 100 trials leaves a one-sided 95% upper failure bound of about 2.95%. The observed score is accurate; the reliability claim goes further than the evidence.
A sample-size calculation can make that gap visible. It cannot rescue a weak test set, a grader that misses violations or repeated cases that share the same failure mechanism. The calculation below assumes independent trials with a fixed failure probability and a sample size chosen before examining outcomes. Treat those as conditions to justify, not properties that appear because a script prints a percentage.
What zero observed failures supports
The NIST description of the binomial distribution gives the probability of a count of binary outcomes and specifies a fixed probability across trials. Under the independent-trial model, if the failure probability is p, the probability of observing no failures in n trials is:
P(zero failures) = (1 - p)^n
For a true failure probability of 1%, a batch of 100 trials has about a 36.6% chance of containing no failures. A clean batch is therefore quite compatible with that failure rate. You have not obtained strong evidence that the rate is below 1% merely by seeing zero.
NIST’s confidence-interval guidance describes exact binomial intervals for small failure counts. Its displayed exact two-sided construction allocates probability to both tails. Here we need an upper limit only. Allocating alpha = 0.05 to that tail and setting the observed failure count to zero gives:
(1 - upper)^n = alpha
upper = 1 - alpha^(1/n)
This is the exact one-sided zero-failure binomial bound, evaluated numerically. It differs from the upper end of a two-sided 95% interval. Keep “one-sided” in the report rather than comparing the two as though they were the same calculation.
| Fully assessed trials | Observed failures | 95% one-sided upper failure bound |
|---|---|---|
| 30 | 0 | 9.5034% |
| 100 | 0 | 2.9513% |
| 300 | 0 | 0.9936% |
| 1,000 | 0 | 0.2991% |
These are mathematical examples, not measured agent results. A frequentist confidence bound describes the coverage of the procedure over repeated samples under its assumptions. It does not assign a 95% probability to this particular agent’s unknown failure rate, and it does not predict that the next production batch will stay below the bound.
Define the failure before counting trials
An agent may answer the question correctly after reading a document the user was not allowed to access. A final-answer grader can mark that run successful while the access-control test marks it failed.
Choose the outcome that the release decision needs. For an unauthorised retrieval gate, define failure as any prohibited document reaching the specified boundary, then observe that boundary. Do not use final-answer quality as a substitute. The confidence calculation applies to the event your measurement detects, which may be narrower than the harm you intend to prevent.
Freeze the grader and check it against known failures before starting the release batch. Include cases where the answer looks plausible despite the violation. If a trace is missing or the grader crashes, the outcome is unresolved. Excluding that row and keeping the claim “zero failures in the scheduled batch” would conceal incomplete measurement.
The trace-sampling example covers a related accounting problem: retained traces may not represent all runs. Establish the expected case inventory first. A confidence interval calculated over the wrong inventory gives a precise-looking answer to the wrong question.
For a severe boundary violation, one observed failure can be enough to block a release regardless of the estimated average rate. The acceptable threshold is an engineering and risk decision. The formula does not choose it for you.
Run the calculator
Download zero-failure-bound.py and run it with Python 3.9 or later:
python3 zero-failure-bound.py
python3 -O zero-failure-bound.py
The standard-library program prints the table values above, calculates two planning examples and runs ten unit tests. It makes no model calls, writes no files and contains no production observations. Both ordinary and optimised execution run the tests; they use unittest checks rather than removable Python assert statements.
The implementation uses log1p and expm1 to avoid losing precision when subtracting values close to one:
return -math.expm1(math.log1p(-confidence) / n)
It rejects zero or negative sample sizes, fractional counts and invalid confidence levels. It also refuses nonzero failures or unknown outcomes. That restriction is deliberate: this small calculator implements the zero-failure case only. If a failure occurs, use an appropriate general binomial interval or the predeclared release rule. Do not delete the failing row to keep using this function.
The tests verify the probability equation, planning minimality, the direction of changes in sample size and confidence, invalid inputs and numerical behaviour at a large sample size. They establish the calculator’s local behaviour. They cannot establish that your cases are independent or your grader is accurate.
Plan the batch before inspecting its score
For a target upper failure bound t, rearranging the same equation gives the required sample size:
n >= log(alpha) / log(1 - t)
Round up to a whole trial. At 95% one-sided confidence, the calculator requires 299 trials with zero failures for an upper bound at or below 1%. For a 0.1% target, it requires 2,995. Those are conditional planning results: every trial must be assessed, all must pass, and the binomial assumptions must be defensible.
Write the target, confidence level and sample size into the evaluation plan before seeing the batch. Also specify the response to a failure or incomplete outcome. A release gate should not become “keep trying until a clean-looking report appears”.
Repeatedly inspecting a growing sample and applying an ordinary fixed-sample interval as a stopping rule can change its coverage. If continuous monitoring is the requirement, select a sequential method designed for that use. This calculator provides no sequential guarantee. Likewise, tuning a prompt against a test set and then reporting the same set as fresh release evidence confuses development feedback with evaluation.
Retries need their own accounting. The repeated-trial article separates first-attempt success from eventual success. Decide which event your bound describes before collapsing a multi-attempt task into a binary result.
More paraphrases may add little evidence
Suppose a RAG evaluation contains many paraphrases of questions about one policy document. If the document has a broken access-control mapping, those cases can fail together. If its mapping is correct, they can all pass while other source families remain untested.
Treating each paraphrase as an independent draw from the production workload requires justification. The same concern applies when trials share a tenant, cached answer or backend outage. Repeating the model call with a new random seed does not remove every shared cause of failure.
Start by recording those groupings. Use the source-family split procedure to separate closely related evidence across development and evaluation. Sample from a declared target workload, and report important slices such as tenant boundary cases separately. Do not turn a deliberately enriched adversarial challenge set into an estimate of ordinary traffic frequency without a sampling argument.
There is no universal correction that converts a pile of correlated agent runs into an honest independent sample size. Depending on the design, you may need cluster-aware analysis, a differently sampled batch or a narrower claim limited to the tested cases. Increasing the nominal count alone does not solve that problem.
Put the limits in the release record
A useful hypothetical record would read:
Zero detected unauthorised retrievals in 300 fully assessed trials. The 95% one-sided upper binomial bound is 0.9936%, conditional on independent trials with a fixed failure probability. The test covers the declared workload and grader version; it does not cover untested tenants or later configuration changes.
Attach the case manifest, workflow version, grader version and known exclusions. Record why the sampling assumptions are plausible. If that explanation is missing, keep the observed count but withhold the broad reliability claim.
For the wider evaluation workflow, see AI Agent Evals. Get the book on Leanpub.
Before approving the next clean batch, ask its owner to name the failure event, the sampling unit and the population the claim covers. Then calculate the bound that the actual sample supports.