An agent service can return a p95 of 100 milliseconds while one request in ten times out after two seconds. The percentile calculation can be correct. The release decision can still be wrong.
The mistake is presenting the latency of successful requests as evidence that the service meets a user-facing objective. I would keep that panel for diagnosis, but I would not approve a rollout from it. The release report needs an explicit count of requests that received a successful response within the agreed time, divided by all eligible arrivals.
Google’s SRE monitoring chapter recommends distinguishing successful-request latency from failed-request latency and tracking error latency rather than filtering errors away. It also warns that fast failures can make a combined latency metric misleading. Those two observations rule out an easy repair: putting every outcome in one histogram and calling the resulting p95 sufficient.
A two-second timeout disappears from a 100 ms dashboard
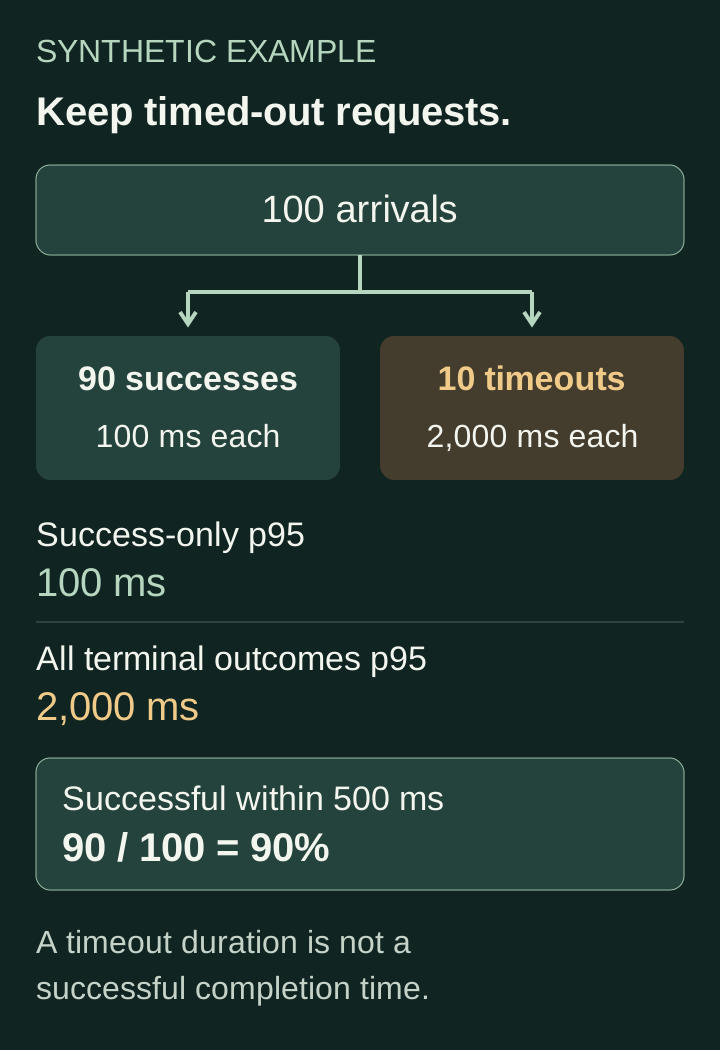
Consider a closed cohort of 100 requests. These are synthetic observations chosen to make the accounting visible:
- Ninety requests succeed after 100 ms each.
- Ten requests receive a timeout outcome after 2,000 ms each.
- Every arrival has exactly one recorded caller-visible terminal outcome.
Using the nearest-rank percentile convention, the success-only p95 selects observation 86 from the 90 successes. Every value is 100 ms, so the result is 100 ms. The p95 over all terminal durations selects observation 95 from 100. That observation is a timeout at 2,000 ms.
Neither calculation says how long a timed-out request would have taken to succeed. The second measures time until the caller received a terminal outcome, including an unsuccessful one.
Now define the operational target: at least 95% of eligible requests must succeed within 500 ms. The observed good fraction is 90 / 100 = 90%. This cohort fails that target even though its successful-request p95 sits comfortably below 500 ms.
Changing the denominator to successful requests produces 90 / 90 = 100%. That answers a narrower question and removes every timeout from the release decision. A dashboard title such as “requests within target” would conceal that change.
This failure is separate from averaging worker percentiles. Correct aggregation cannot restore requests that instrumentation never observed or that the query deliberately excluded.
A timeout is an observed boundary, not a completed answer
Suppose a caller stops waiting after two seconds. You know the duration until that caller timed out. You do not necessarily know whether the backend stopped, completed later or committed a tool effect before the response was lost.
If you are studying time to a backend completion and observation stops while the backend is still running, the completion time is right-censored at the observation boundary. NIST’s explanation of censoring describes the general statistical problem: exact event times beyond a fixed observation limit are missing. Its examples concern reliability tests; applying that concept to completion latency requires defining the event and observation process explicitly.
Cancellation complicates the interpretation. If the system kills the work at the deadline, a later successful completion may never exist. Treating the timeout as an exact two-second success fabricates an outcome. Treating it as a sample from an otherwise unchanged completion process can also be unjustified.
Keep the measurements separate:
- Caller-visible duration ends when the caller receives success, an error or a timeout, or when the chosen cancellation boundary occurs.
- Backend execution duration ends when the worker actually stops. It can continue beyond the caller’s deadline.
- Time to successful completion is observed only when that event occurs under the defined experiment.
- A successful-within-threshold indicator records whether this eligible request met the service objective.
The fixture below calculates the first and fourth measurements. It makes no estimate of the missing successful completion times. A survival model would need additional assumptions and data; a percentile function cannot supply them.
For a tool-using agent, retain the backend operation identifier in the trace so an unknown write outcome can be reconciled. Do not turn a latency timeout into permission to retry a payment or deployment. That is a separate effect-accounting decision.
Run the closed-cohort example
Download agent-timeout-latency.py, inspect it and run it with Python 3.9 or later:
python3 agent-timeout-latency.py
python3 agent-timeout-latency.py \
  --test
python3 -O agent-timeout-latency.py \
  --test
The script has no dependencies outside Python’s standard library. It makes no network calls and invokes no model. Its default output includes:
{
  "arrivals": 100,
  "successful_request_p95_ms": 100,
  "terminal_outcome_p95_ms": 2000,
  "good_events": 90,
  "good_event_denominator": 100,
  "good_fraction": 0.9,
  "threshold_ms": 500
}
This excerpt omits the outcome-count dictionary from the full output. The script’s twelve unit tests run in ordinary and optimised Python. They check the synthetic result, missing and duplicate requests, invalid durations and the inclusive 500 ms threshold. A fast error or cancellation never becomes a good event. When there are no successes, the success-only p95 is null, not zero.
The report function requires an expected arrival inventory. It refuses a partial result set rather than quietly calculating a flattering report from the rows that happened to arrive. This is a deliberately small accounting fixture, not a production telemetry collector: the caller remains responsible for a correct inventory and truthful outcome labels.
Close the cohort before declaring the result
A live service rarely hands you a tidy closed cohort. At the end of a five-minute interval, some requests are still running. Counting starts in that interval and dividing successes completed in the same interval can mix different populations. Some completions belong to earlier arrivals; some new arrivals have not had a chance to finish.
For a release experiment, assign requests to the cohort by arrival time, retain their identifiers and allow the defined observation period to finish. Reconcile each arrival to a terminal outcome or mark it unresolved. The downloadable example rejects unresolved cohorts because it has no policy for classifying pending observations.
An operational SLI can instead use a consistently defined terminal-event population, provided the service also exposes in-flight work and overdue requests. Document that choice. If workers can vanish before recording a terminal event, a completion-only denominator can lose the very requests you need to count. Reconcile starts with terminals through a durable request record or a separate observer, and alert on gaps.
Retries belong inside the original user-request boundary when the promise concerns the user’s wait. Keep attempt counts for diagnosis, but do not reset the elapsed timer or add a new successful user request each time a model call retries. The retry evaluation example shows how replacing failed attempts with eventual successes changes what a reported rate means.
For streaming, decide whether the objective ends at the first token, a complete response or a verified usable answer. Those are different events. A stream that starts quickly and then fails should not count as a successful complete answer.
Keep the histogram and the good-event counter
Use bounded outcome labels such as success, timeout, error and cancelled on duration observations. Retain separate outcome counts. Request IDs and prompts belong in appropriately protected traces or records, not metric labels.
Prometheus’s histogram guidance explains how distributions support aggregation and how bucket counts can measure observations within a threshold. If the objective is successful responses within 500 ms, include that exact boundary in a classic histogram or maintain an explicit good-event counter. Make the denominator use the same eligibility and cohort policy.
Success-only p95 helps diagnose the requests that worked. Timeout count and duration show the failed waits. A good-event fraction determines whether the declared objective was met. Preserve all of them; a fast authentication rejection must not compensate for a slow successful answer, and a low successful-request p95 must not hide a growing timeout count.
My book AI Agent Evals on Leanpub covers the wider work of defining assessable outcomes and building release evidence.
For the next latency review, run the synthetic cohort through your reporting path. Require the report to show 100 arrivals, ten timeouts and a 90% successful-within-500-ms fraction. If it reports 100%, inspect the denominator before changing the model.