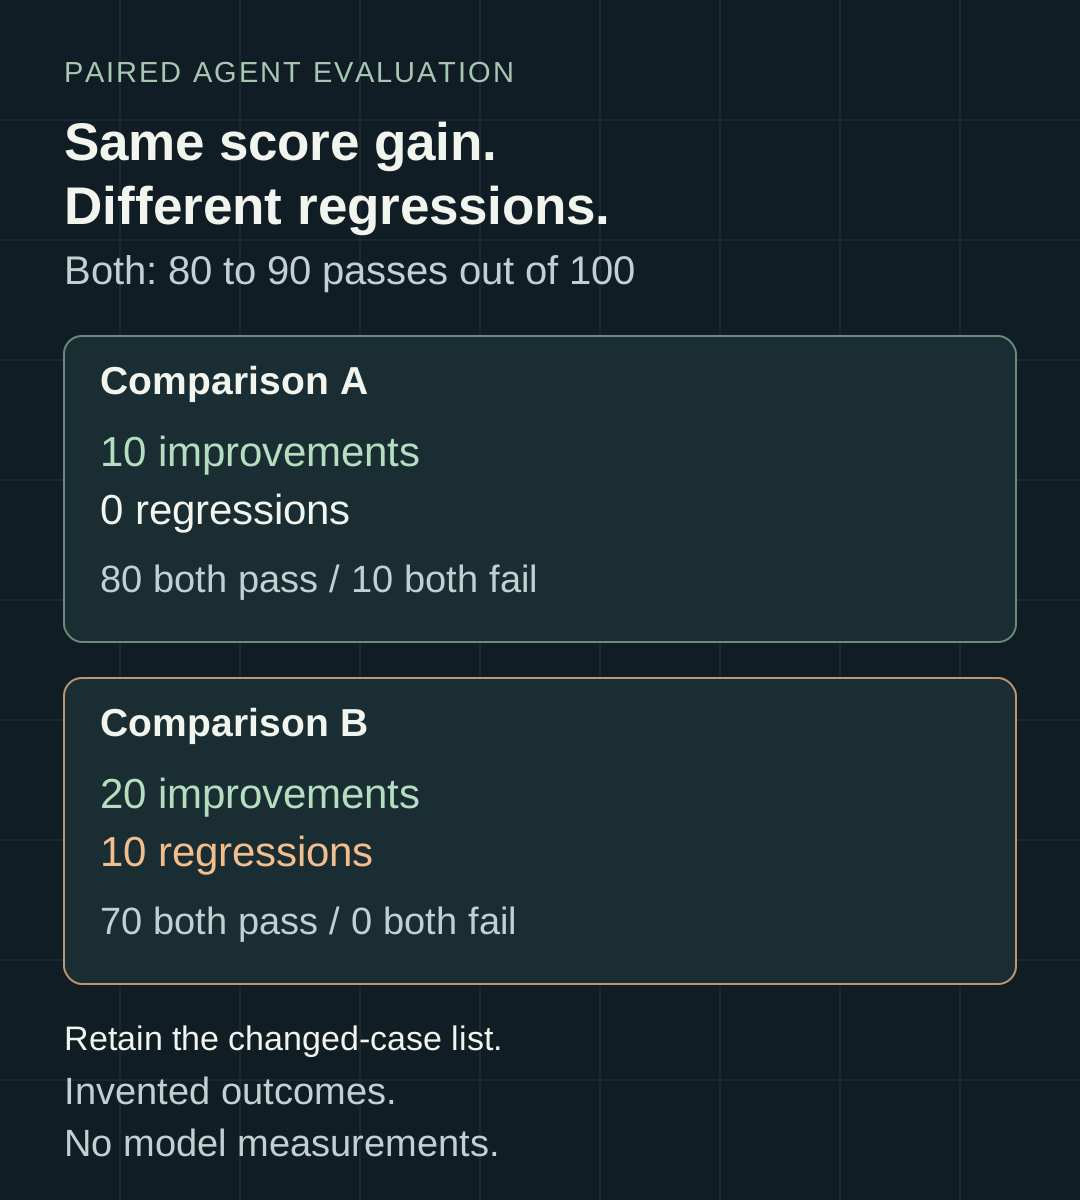
An agent update moves from 80 passes to 90 on a hundred evaluation cases. Before approving it, I want the identifiers of the cases it stopped passing.
That score could mean ten previously failing tasks now work and everything else stays the same. It could also mean twenty tasks improve while ten previously working tasks break. Both produce the same headline. They give an engineer different investigation lists, and they provide different statistical evidence about the direction of change.
Keep the baseline and candidate outcomes paired by case. Two totals throw away information you already paid to collect.
The same improvement, two different comparisons
The following examples use invented Boolean verdicts. They are accounting fixtures, not results from an agent or claims about a model. Each comparison evaluates its baseline and candidate on the same hundred cases.
| Paired outcome | Comparison A | Comparison B |
|---|---|---|
| Both pass | 80 | 70 |
| Baseline passes, candidate fails | 0 | 10 |
| Baseline fails, candidate passes | 10 | 20 |
| Both fail | 10 | 0 |
| Baseline total passes | 80 | 80 |
| Candidate total passes | 90 | 90 |
Comparison A has ten improvements and no observed regressions. Comparison B has twenty improvements and ten regressions. Each gains ten passes overall, or ten percentage points.
If one of B’s regressions is an unauthorised refund, the extra successful answers elsewhere do not make it acceptable. Keep the separate permission-boundary release gate. Pairing adds the exact changed-case list and a way to analyse directional evidence; it does not replace a policy about unacceptable failures.
Even when every case has equal operational weight, the two comparisons differ. A changed ten outcomes, all in the same direction. B changed thirty, with a less consistent direction. A test using only the two marginal totals cannot recover that difference.
Test the disagreements between versions
For paired binary outcomes, McNemar’s test checks equality of the marginal outcome probabilities. The statsmodels documentation describes its exact binomial form and its large-sample chi-square approximation. Here we use the exact form.
Call the number of regressions b and the number of improvements c. Conditional on the total number of disagreements, the null hypothesis assigns equal probability to either direction. The exact calculation therefore uses a binomial distribution with n = b + c and probability 0.5.
For this symmetric null, the two-sided p-value is twice the lower tail through min(b, c), capped at one:
from fractions import Fraction
from math import comb

n = b + c
p_value = min(
    Fraction(1),
    Fraction(2 * sum(comb(n, k) for k in range(min(b, c) + 1)), 2 ** n),
) if n else Fraction(1)
The fixture uses integer arithmetic and a rational fraction before converting the answer to a float for display. Its results are:
- Comparison A: 0 regressions, 10 improvements, two-sided p = 0.001953125.
- Comparison B: 10 regressions, 20 improvements, two-sided p = 0.0987371467.
At a significance level of 0.05 chosen before examining the outcomes, A rejects the equal-marginals null. B does not. That is a statement about this test under its assumptions. It is not a probability that the candidate is better, and B’s result does not establish equivalence or the absence of an improvement.
Cases where both versions pass or both fail still belong in the report and in the pass-rate denominator. They do not enter this conditional test’s disagreement count. If there are no disagreements, the fixture reports p = 1. That convention must not become a claim that the versions behave identically on future tasks.
SciPy’s binomial-test documentation defines the underlying hypothesis test and its alternatives. With a positive disagreement count, binomtest(b, b + c, p=0.5, alternative="two-sided") provides the corresponding calculation. This article’s small standard-library implementation is limited to the symmetric null used here; it is not a general replacement for SciPy.
Run the paired-outcome fixture
Download paired-agent-eval.py, inspect it, and run it with Python 3.9 or later:
python3 paired-agent-eval.py
python3 paired-agent-eval.py --test
python3 -O paired-agent-eval.py --test
The first command prints both synthetic comparisons as JSON. The other commands run the same twelve unit tests in ordinary and optimised Python. The script makes no network calls and executes no agent.
compare(expected_ids, rows) accepts an explicit case inventory and rows containing (case_id, baseline_bool, candidate_bool). It rejects missing observations, unexpected identifiers, duplicate rows and duplicate expected identifiers. Both verdicts must be actual Booleans: an integer 1, a string "pass" or an unknown None is invalid.
This validation prevents a particularly misleading comparison: joining two result files on their common case IDs and silently dropping everything missing from either side. A candidate that timed out on the hardest tasks could otherwise appear to improve after the join removed those tasks.
Decide the treatment of timeouts before the experiment. A task-level timeout may be a valid failure under the rubric. A broken recorder may instead leave the result unassessable and require investigation. The comparison function cannot make that judgement; it refuses unknown verdicts so the caller cannot quietly erase them.
The implementation caps the inventory at 10,000 cases to bound this teaching calculation. It does not load result files, verify the grader or emit a release decision. Successful script execution means the calculation ran, not that a candidate passed a deployment gate.
Preserve the experiment, not only the case ID
Pairing on a string is necessary but insufficient. Both versions need the same task definition, rubric and comparable starting conditions. If one version uses yesterday’s customer ledger and the other uses today’s, the apparent regression may come from the changed data.
Record the case-set and grader versions, the tested implementation and model configuration, and the initial-state reference. Use isolated state so one trial cannot clean up a resource for the next. If external data must remain live, document the exposure and use a design that controls time effects rather than pretending the inputs were frozen.
Stochastic agents need more care. A single paired run describes those observations. Repeated runs can reveal instability, but repeated attempts on the same task are clustered observations. Ten paraphrases of one support ticket are also not automatically ten independent tasks. The exact binomial model used above assumes independent pairs with the stated null structure.
For repeated trials or related task families, choose an analysis that respects that grouping, such as resampling independent task families while retaining the observations inside each family. Have the experiment owner specify the unit of analysis before running the comparison. Do not feed every retry into McNemar’s test as another independent vote. The retry-accounting example explains the separate problem of replacing failed attempts with eventual successes.
Keep statistical evidence separate from release policy
A small p-value does not measure the operational size of an improvement. A large one does not certify safety. Report the net effect, the regression count and the uncertainty analysis alongside any significance decision. If the release question is whether degradation stays within an acceptable margin, define that margin and use a suitable non-inferiority design. Failing to reject equality cannot answer it.
Avoid choosing the most flattering result after trying many prompts, models or subsets on the same evaluation set. Specify the comparison and analysis before looking at the held-out outcomes. Use a separate development set for iteration; account for multiple comparisons when the experiment requires them.
For a fixed, hand-built challenge suite, the most defensible statement may be the descriptive one: these ten cases regressed under these conditions. A p-value does not turn a convenience sample into a representative estimate of production quality. Nor does zero observed regression prove a zero future regression rate; the zero-failure confidence example covers that limitation.
My book AI Agent Evals on Leanpub develops the wider process of testable task definitions, trustworthy graders and release evidence.
For your next comparison, retain one row per expected case with both verdicts and links to the underlying observations. Generate the regression list before the summary score reaches the release reviewer. Investigate each prohibited effect separately, even when the candidate’s overall score rises.